“`html
How to Effectively Find the Slope of a Graph
Understanding the Slope of a Graph
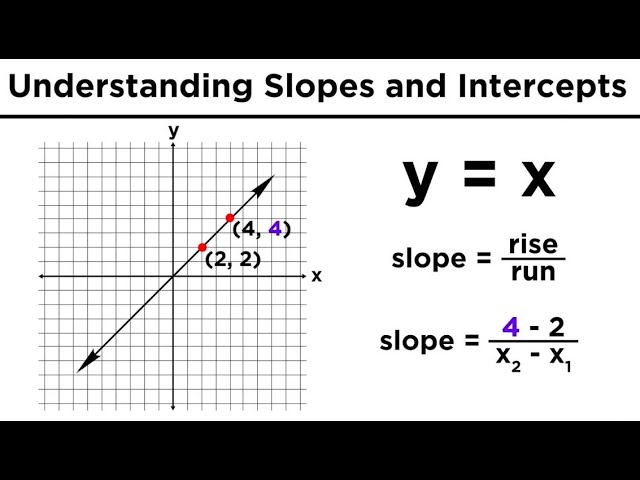
The **slope of a graph** is a fundamental concept in coordinate geometry, representing the steepness and direction of a line. It is essential for interpreting linear equations and understanding graph plotting. It can be quantified using the **slope formula**, which often expresses the steepness of the line as the ratio of the vertical change (rise) to the horizontal change (run). A proper understanding of this concept allows for effective **graphical representation**, such as in statistical data analysis or engineering applications. You can visualize the slope using the rise over run method, which simplifies the **calculating slope** process, especially for those just starting to learn about this topic.
Core Definitions and Properties of Slope
The **slope** defines how much the dependent variable, typically represented on the y-axis, changes for a given change in the independent variable on the x-axis. It can be positive, negative, zero, or undefined. A **positive slope** indicates an upward movement from left to right, while a **negative slope** suggests a downward trend. Zero slope indicates a **horizontal line slope**, showing no vertical displacement regardless of horizontal movement, whereas an **undefined slope** corresponds to a **vertical line slope**. Understanding these variations is pivotal in interpreting graphs accurately.
Calculating the Slope Using Coordinate Points
To find the **slope of a line** given two points on the graph, you can use the **slope formula**, which is (y2 – y1) / (x2 – x1). Let’s say you have two points, (2, 3) and (5, 11). Here’s how to make the necessary calculations: First, determine the rise by subtracting the y-coordinates, so 11 – 3 = 8. Next, compute the run by subtracting the x-coordinates, giving us 5 – 2 = 3. Applying our slope formula, we see that the slope is 8 / 3, which is approximately 2.67. This calculation portrays a steepness measurement of the line, essential for graph interpretation and applications.
Slope in Real Life Applications
The application of slope extends beyond just mathematics; it has various practical implications in real life, from engineering projects to economics. Understanding the **slope significance** allows professionals to analyze trends effectively, such as in horizontal and vertical growth in businesses. Additionally, in physics, driving characteristics can be assessed by analyzing the steepness of paths. This computational understanding becomes significant in creating models that predict behaviors under varying changes in topography or data sets. For students, recognizing the operational use of slope helps illustrate its relevance in everyday scenarios.
Graphical Tools for Calculating Slope
With the advancements in technology, numerous **slope calculators** are available that can assist in this task. Software and graphical tools allow users to input points and automatically calculate slopes. Additionally, visualizing the graphs with tools allows users to see the **slope change** dynamically as values adjust. Platforms like online graphing calculators provide a direct way to interpret and manipulate graphs to highlight slope discussions and visual slope aids that enhance understanding.
Graphical Representation and Graph Plotting
Visualizing slope on a graph enhances intuitive measures of it. When plotting a linear equation, it is crucial to recognize the equation’s components such as the slope-intercept form (y = mx + b), where ‘m’ denotes the slope. This representation facilitates easier graph plotting that visually denotes the **slope direction** and its impact. For practical users, employing graphing tools helps bridge the gap between analytical solutions and applied mathematics in academic or engineering contexts.
Understanding Common Slope Misconceptions
One prevalent issue among students is understanding how steepness and directional changes correlate with slope values, also known as **slope characteristics**. Many struggle with cases when slopes are zero or undefined. It is vital to clarify these points during instruction to avoid common slope mistakes. Implementing visual aids can be beneficial; utilizing graphs of different types of slopes helps illustrate these distinctions effectively.
Finding Slope Between Two Points Visually
To reinforce the understanding of slope, let’s visualize it practically. Consider graphing the points (1, 2) and (4, 6) from a clear xy-coordinate system. By marking these points, students can utilize the **rise and run method**: Move vertically from (1, 2) to (1, 6) (which encompasses a rise of 4 units), then horizontally from (1, 6) to (4, 6) (a run of 3 units). Hence, using the rise/run gives us a slope of 4/3. This visual and step-by-step method solidity’s the concept and aids in grasping the significance of slopes in different contexts.
Practical Steps to Calculate Slope
The following steps present a user-friendly guide to calculating the slope from any graph. First, select two clearly defined points on the line. Next, note these coordinates as (x1, y1) and (x2, y2). Utilize the ***slope formula*** to plug in these values: (y2 – y1) / (x2 – x1). Calculate the resulting rise and run, and finally interpret the slope based on its value for a complete understanding of its implications.
Applying the Slope to Graphical Data Interpretation
Leverage slope applications in everyday scenarios such as in operational efficiency assessments or rise in stock values. For instance, when evaluating a company’s financial growth over time, representing data points on a graph and mastering the **slope calculation methods** can result in more proficient data analysis. Analysts often misrepresent slope when analyzing complex data; hence clear identification and practical steps to manage slope calculations soften learning challenges.
Visualizing Slope with Real-World Examples
Consider the practical example of land surveying, where slopes are utilized to assess land for construction. By calculating the **slope applications in physics**, surveyors can determine proper angles necessary for building structures. Understanding both the increasing and decreasing slopes provides a heavy advantage in engineering and construction tasks.
FAQ
1. What is the slope of a horizontal line?
The slope of a horizontal line measures zero. Regardless of the movement along the x-axis, there is no vertical change; hence the rise is zero. Therefore, the practical formula yields a slope of zero, illustrating an entirely flat line.
2. How do we determine slope using coordinate geometry?
Using coordinate geometry, the slope between two points can be determined with the formula **(y2 – y1) / (x2 – x1)**. This process involves identifying two points on the graph, subtracting their y-values for the rise, and subtracting their x-values for the run.
3. Can slopes be represented in real-world scenarios?
Yes, slopes have various representations in real life, from economics where they measure profit trends, to physics where they assess angles of inclines and heights of hills. Recognizing slopes assists in evaluating practical applications effectively.
4. What is the significance of slope in linear equations?
The slope in a linear equation signifies the rate of change between two values. This value indicates how much increase or decrease will occur in the dependent variable for each unit increase in the independent variable, crucial for predictive modeling.
5. What tools can help visualize and calculate slopes?
Online slope calculators and graphing software are valuable tools for visualizing and calculating slopes. These platforms provide users with features to plot points and instantly derive slope values to enhance comprehension of the concept.
6. Are there different types of slopes?
Yes, slopes can vary significantly including positive and negative types, zero and undefined slopes. Each type illustrates specific directional movements on a graph that are crucial for broader understanding in both academic and real-world contexts.
7. How do rise and run relate to finding slope?
The rise and run method directly relates to finding the slope by quantifying the vertical change (rise) over the horizontal change (run) between two points. This simplification not only aids in mathematical accuracy but also enhances the conceptual understanding of slope.
“`