Cumulative Frequency: A Simple Guide for 2025
Cumulative frequency is a fundamental concept in statistics that plays a crucial role in data analysis. Understanding how to calculate cumulative frequency helps in interpreting data sets, providing insight into the distribution and trends. In this guide, we will explore the concept of **cumulative frequency**, how to create a **cumulative frequency table**, its graphical representation, as well as practical applications in various fields.
Understanding Cumulative Frequency
**Cumulative frequency** involves summing up the frequencies of a data set up to a certain point. This method allows for a clear understanding of how data accumulates over intervals or categories. In **frequency distribution**, cumulative frequency helps visualize data trends by allowing researchers to easily ascertain the number of observations below a particular value. For instance, if you have a dataset representing exam scores, calculating cumulative frequency can show the number of students securing marks up to certain thresholds, facilitating comparison and evaluation.
The Importance of Cumulative Frequency
The **importance of cumulative frequency** lies in its utility in comparisons and data summarization. By turning raw data into a cumulative frequency analysis, one can simplify the understanding of large datasets. This is especially beneficial in educational statistics – for example, determining how many students scored above or below a particular mark. This concept not only aids in **data interpretation**, it also supports the assessment of skewness or symmetry in data distributions, plays a pivotal role in statistical hypothesis testing, and allows for better-informed decision-making.
Cumulative Frequency in Frequency Distributions
In **frequency distributions**, cumulative frequency tables make it easier to showcase the accumulation of frequencies across categories. When analyzing grouped data, the transformation of raw frequencies into cumulative figures creates clearer visual representations, such as **cumulative frequency graphs**. These graphs illustrate the running total of frequencies and also enable the calculation of percentiles effectively. The cumulative distribution function derived from this analysis adds depth to our understanding of the dataset’s characteristics.
How to Calculate Cumulative Frequency
To **calculate cumulative frequency**, you’ll proceed through a series of steps. First, you’ll need a dataset defined in various frequency intervals. For each interval, the cumulative frequency is computed by adding the frequency of that interval to the cumulative frequency of the previous interval.
Practical Example: Step-by-Step Calculation
Let’s consider a set of test scores in intervals: 0-10, 11-20, 21-30, and so on. In a hypothetical dataset, the frequencies could be represented as follows:
- 0-10: 5
- 11-20: 10
- 21-30: 15
- 31-40: 20
To calculate cumulative frequency:
- For the first interval (0-10): Cumulative Frequency = 5
- For the second interval (11-20): Cumulative Frequency = 5 + 10 = 15
- For the third interval (21-30): Cumulative Frequency = 15 + 15 = 30
- For the fourth interval (31-40): Cumulative Frequency = 30 + 20 = 50
This yields a cumulative frequency of 5, 15, 30, and 50 respectively, which can then be organized into a **cumulative frequency table**. Such a table provides a quick reference for analyzing data patterns effectively.
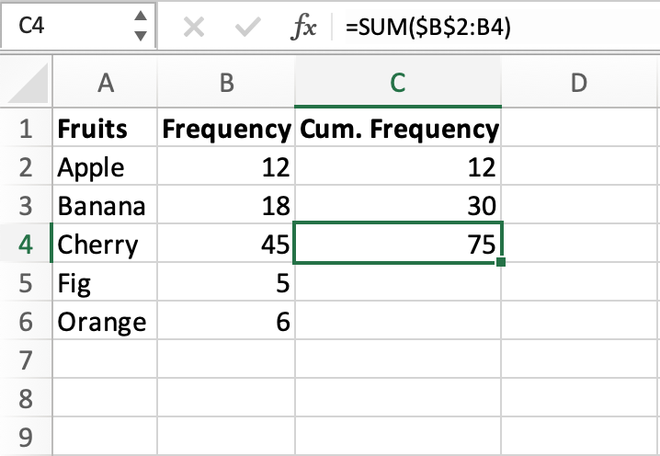
Tools for Calculating Cumulative Frequency
With the advent of technology, several software tools can assist in calculating cumulative frequency from larger datasets quickly. Statistical software such as SPSS, Excel, or specialized applications for educational statistics can automate these calculations. Additionally, creating a **cumulative frequency graph** (also known as an ogive) becomes simple with these tools. By plugging in your data, you can visualize how frequencies accumulate, offering immediate insights into distribution trends.
Creating Cumulative Frequency Graphs
Graphical representation is essential for understanding cumulative frequency. A **cumulative frequency graph** typically plots cumulative frequency against the upper bounds of intervals. With this visualization, it becomes easier to interpret and analyze data distributions and comparative results.
Steps to Create a Cumulative Frequency Graph
To create a **cumulative frequency graph**, follow these steps:
- Utilize your cumulative frequency table, identifying the intervals and corresponding cumulative frequencies.
- Plot the upper boundary of each interval on the x-axis and the cumulative frequency on the y-axis.
- Connect the points with line segments to visualize the cumulative progression.
Through this method, data visualization answers specific questions about data trends, such as identifying medians or quartiles at a glance.
Cumulative Frequency Histograms vs. Graphs
A **cumulative frequency histogram** displays the cumulative frequencies of data intervals, contrasting against the traditional histogram which depicts individual frequencies. While both serve as visual tools for data analysis, the cumulative frequency histogram helps in understanding accumulative trends rather than just isolated data counts. Both graphical representations are pivotal in educational contexts, enriching the comprehension of statistical distributions among students.
Real-Life Applications and Benefits of Cumulative Frequency
The real-world applications of cumulative frequencies are wide-ranging and impactful. In fields such as education, health, and market research, cumulative frequency facilitates insights into populations, performance assessments, and behavioral predictions. By employing **cumulative frequency analysis**, you can make strategic decisions grounded in statistical evidence.
Analyzing Trends in Research and Surveys
Cumulative frequency plays a major role in analyzing survey data, helping assess trends and statistics in consumer behaviors, educational achievements, and demographic studies. It helps in identifying important segments of the population that require focus and can inform strategic planning and targeted interventions based on identified data insights. More specifically, researchers use cumulative frequencies to demonstrate significant findings regarding population distributions, enhancing **data evaluation** practices across various sciences.
Education and Statistical Literacy
In educational settings, teaching cumulative frequency and its importance fosters statistical literacy and understanding of data analysis. Students benefit from learning how to lay out frequencies in a **cumulative frequency table**, thus enabling them to derive insights from data efficiently. An application of this in classrooms encourages students to develop analytical thinking skills necessary for varied contexts, from economics to social sciences. By embracing cumulative frequency, educators can make data interpretation more accessible.
Key Takeaways
- Cumulative frequency is essential for understanding and summarizing large data sets.
- Creating a cumulative frequency table aids in efficiently calculating and documenting frequencies.
- Graphical representations like cumulative frequency graphs and histograms simplify data interpretation.
- Cumulative frequency informs strategic decision-making across various fields, from education to market research.
- Learning about cumulative frequency fosters critical thinking and enhances statistical literacy.
FAQ
1. What is the cumulative frequency in basic statistics?
Cumulative frequency accumulates the counts of representation in a dataset up to a specified interval. It provides insights into data distributions, indicating how many observations fall below given values. This is often useful in statistical studies, educational use, and other **data visualization** contexts.
2. How can cumulative frequency aid in analyzing data trends?
Cumulative frequency can identify trends within a dataset by illustrating concentrations of data points across various intervals. By accumulating frequencies, analysts can discern patterns, leading to better decision-making and insightful explorations of the dataset.
3. What are the most effective tools for calculating cumulative frequency?
Many statistical analysis tools like Excel, SPSS, and various online calculators simplify cumulative frequency calculations. These tools enhance accuracy and speed in calculating **cumulative frequency** from massive datasets and provide graphical outputs accordingly.
4. How does cumulative frequency apply in educational statistics?
In educational contexts, cumulative frequency allows educators to gauge student performance across various assessment ranges, helping identify areas that require intervention or enhancement. By utilizing **cumulative frequency analysis**, patterns of achievement can be assessed over time, tailoring learning approaches effectively.
5. Can cumulative frequency be used in real-world market research?
Yes, cumulative frequency is commonly used in market research to analyze consumer behavior and preferences. It helps in identifying which product categories have greater acceptance among consumers, leading to informed business decisions concerning marketing strategies and product developments.
6. What is the difference between cumulative frequency and frequency distribution?
**Frequency distribution** illustrates how many times each data point occurs within various intervals, while **cumulative frequency** provides a running total of these frequencies, indicating how many observations fall below a certain value. Both are essential in statistical analysis but serve different analytic purposes.
7. How can I visualize cumulative frequency for my dataset?
You can visualize cumulative frequency through graphs known as ogives, or through cumulative frequency histograms. These graphical representations provide a quick method for analyzing and extracting trends from cumulative data, making it easier for practitioners in fields ranging from economics to education to interpret their data effectively.