Effective Ways to Calculate Degrees of Freedom in 2025: Understanding and Applications
Understanding Degrees of Freedom
When it comes to statistical analysis, **degrees of freedom** play a critical role in various tests and calculations. Understanding **degrees of freedom** is essential for accurate interpretation of data and results. Essentially, degrees of freedom refer to the number of independent values in a statistical calculation that can vary. The concept helps in determining the appropriate statistical methods and accurately applying the **degrees of freedom formula** to achieve meaningful results. By grasping this concept, researchers can improve their **statistical analysis techniques** and make more informed conclusions about their data.
The Importance of Degrees of Freedom
In statistics, **degrees of freedom** empower analysts to test hypotheses and estimate population parameters with confidence. They are crucial for managing sample size and establishing statistical power, which examines the likelihood of correctly rejecting a null hypothesis. Without appropriately calculated **degrees of freedom** in hypothesis testing, results may lead to misleading conclusions. For example, when analyzing variance through **degrees of freedom in ANOVA**, calculations provide insights into how group means differ while considering sample sizes. Thus, understanding what **degrees of freedom** signify contributes to effective decision-making across various fields like social sciences, biology, and economics.
How to Find Degrees of Freedom
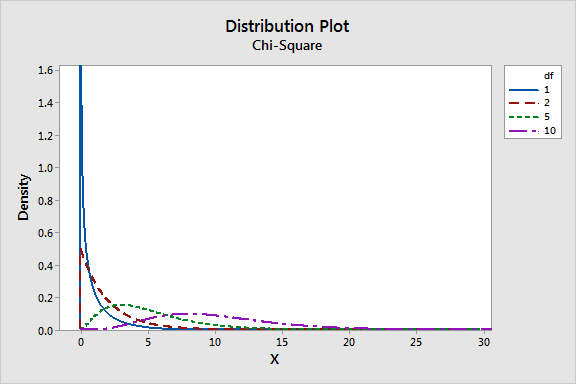
Finding **degrees of freedom** can differ based on statistical tests being used. The most common calculation involves subtracting the number of restricted variables from the total number of variables accounted for in the analysis. For example, in a simple t-test, where there are two independent samples, the formula for calculating **degrees of freedom for independent samples** is \( df = n1 + n2 – 2 \), where \( n1 \) and \( n2 \) are the sizes of the two samples. Similarly, in **chi-square tests**, **degrees of freedom** depend upon the dimensions of the contingency tables utilized. Such distinctions regarding how to calculate degrees of freedom can significantly influence the outcomes of research studies and statistical testing.
Types of Degrees of Freedom
Different statistical analyses utilize various types of **degrees of freedom**, reflecting the underlying structure of the data being analyzed. Understanding the distinctions among these categories helps statisticians tailor their approaches to fit specific tests. Recognizing the specific application of **types of degrees of freedom**—whether it be for t-tests, regression, or ANOVA—is essential for accurate analysis. In each case, it’s vital to apply the correct **degrees of freedom formula**, which is key to drawing valid inferences from data.
Degrees of Freedom in ANOVA
In **ANOVA**, **degrees of freedom** are divided based on how the total variation in a dataset can be explained. Specifically, one needs to calculate both the **degrees of freedom for the between-group variance** as well as the **degrees of freedom for within-group variance**. The formulas are as follows: \( df_{between} = k – 1 \) and \( df_{within} = N – k \), where \( k \) represents the number of groups and \( N \) represents the total number of observations. Correctly calculating these types affects the outcome of the F-statistic, which governs how much evidence exists against the null hypothesis.
Degrees of Freedom in Regression Analysis
When performing regression analysis, calculating **degrees of freedom for regression** is pivotal for determining model validity. Here, we consider the **degrees of freedom in linear regression**, often expressed as: \( df_{model} = p – 1 \) and \( df_{error} = n – p \) where \( p \) stands for the number of parameters. This distinction enables researchers to assess whether the proposed regression model is statistically significant. Additionally, it helps in determining effect size and ensuring that **confidence intervals** are reliable.
Common Mistakes in Calculating Degrees of Freedom
Incorrectly calculating **degrees of freedom** can lead to erroneous interpretations and statistical errors. One common pitfall involves neglecting to adjust statistical measures for sample size, often resulting in underestimated or overstated **degrees of freedom significance**. Misunderstanding group memberships also falls into this category, especially when interpreting **degrees of freedom for paired samples**. Recognizing typical errors becomes crucial for ensuring valid conclusions in statistical analysis, while improperly accounting for sample distributions further complicates accurate calculations in cases like **non-parametric tests** or **twoway ANOVA**.
Examples of Degrees of Freedom in Statistics
Practical examples illustrating proper calculations of **degrees of freedom** underscore their necessity in statistical applications. For example, in a study measuring the effects of two treatments on patient recovery time, researchers can utilize an **independent samples t-test**. Here, with two groups of 30 participants, one calculates \( df = 30 + 30 – 2 = 58 \). Conversely, in a **one-way ANOVA** involving three groups of varying sizes, researchers would summarize total participants and utilize \( df_{between} and df_{within} \) formulas to derive sound statistical interpretations.
Degrees of Freedom Calculation for Contingency Tables
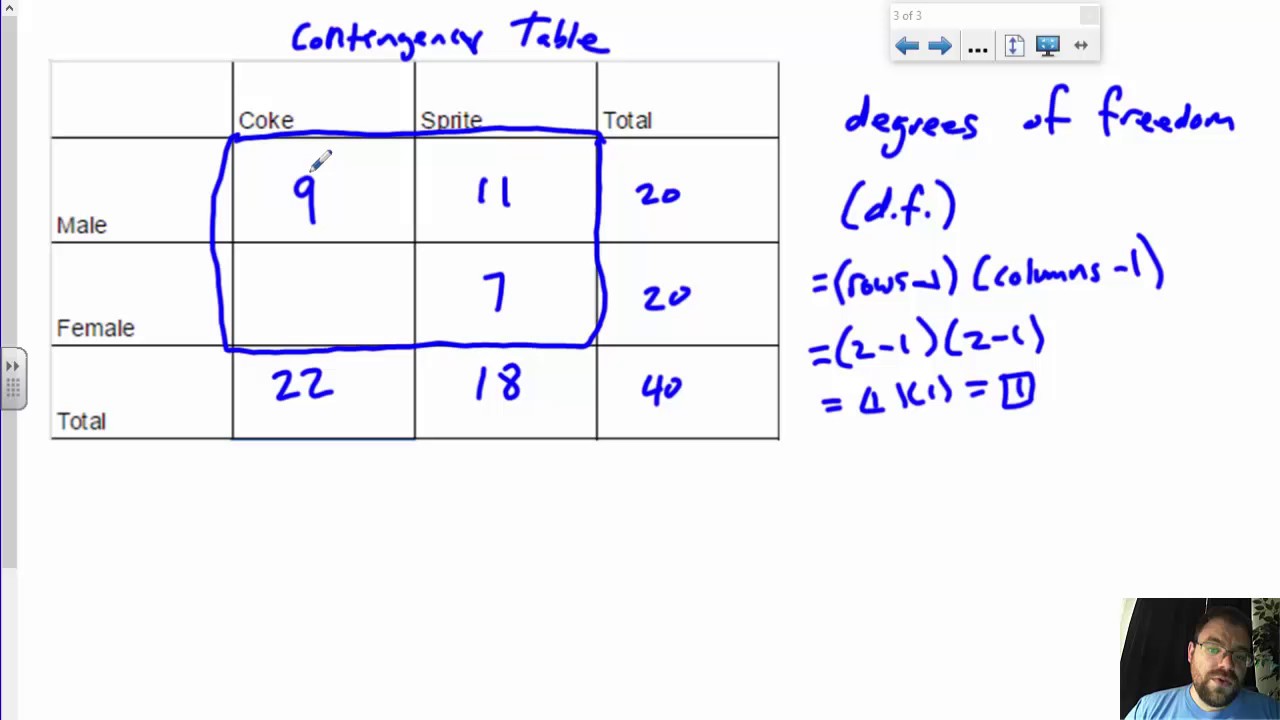
When dealing with categorical data analysis in **contingency tables**, the calculation of **degrees of freedom** typically follows the formula \( (r – 1) \times (c – 1) \), where \( r \) is the number of rows and \( c \) the number of columns. For instance, a table with three rows and four columns would yield \( df = (3 – 1) \times (4 – 1) = 2 \times 3 = 6 \). Such detailed practical instances clarify how various statistical methods require nuanced understanding of **degrees of freedom** to ensure accurate and meaningful analysis.
Key Takeaways
- **Degrees of freedom** are critical in statistical techniques and affecting hypothesis testing.
- Understanding various **types of degrees of freedom** can shape accurate statistical analyses.
- Calculating **degrees of freedom** requires careful application of formulas relevant to each statistical test.
- Common mistakes in calculating can mislead interpretations and impact results significantly.
- Practical examples effectively illustrate proper calculations across multiple contexts.
FAQ
1. What is the importance of understanding degrees of freedom?
Understanding **degrees of freedom** is pivotal as it influences the outcomes of statistical tests, the validity of conclusions, and the interpretation of confidence intervals. It aids in selecting appropriate statistical methods that fit the analysis, thus reducing the likelihood of type I and type II errors in hypothesis testing.
2. How do degrees of freedom differ in various statistical tests?
Degrees of freedom vary widely among different statistical tests. For instance, in a t-test, degrees of freedom depend on the sample sizes, while in ANOVA, they are split between between-group and within-group variances, reflecting the linear model’s structure based on group numbers and total sample size.
3. Can you explain what degrees of freedom mean in regression analysis?
In regression analysis, **degrees of freedom** indicate the number of values in the analysis that are free to vary while fitting the regression model. They are calculated for both the regression model and residuals, allowing researchers to assess the adequacy of their model and the significance of its predictor variables.
4. What common mistakes should be avoided when calculating degrees of freedom?
Common mistakes include failing to adjust for sample sizes leading to incorrect significance levels, misinterpreting group memberships, and overlooking specific tests’ requirements. Each of these errors can distort results and introduce bias into interpretations of statistical analyses.
5. How do degrees of freedom topic relate to sample size?
**Degrees of freedom** are affected directly by sample size; larger sample sizes typically provide more degrees of freedom. For most calculations, notably in t-tests and ANOVA, the sample size plays a critical role in building confidence intervals and determining statistical significance levels in hypothesis testing.
6. What is an example of calculating degrees of freedom in statistical analysis?
An example could be a simple linear regression analysis with 15 data points and two parameters estimated from the model. The **degrees of freedom for regression** would be 2 – 1 = 1, while the **degrees of freedom for the residual** would be 15 – 2 = 13, allowing for the assessment of unexplained variance.
7. How do non-parametric tests use degrees of freedom?
In non-parametric tests, **degrees of freedom** are calculated differently since these tests do not always assume a normal distribution or involve ranks instead of raw data. This method enables researchers to perform analyses even when data do not meet parametric test assumptions, aiding in proper statistical decisions.